Unlocking the Power of Product Analytics: Metrics and Platforms Explained

What is Product Analytics?
Product analytics is a way for you to track what players, customers, users are doing on your website, within your game, or within your mobile app. It is a quantitative way to understand interactions and workflows within your product.
When combined with qualitative user research, such as surveys, product analytics can provide a comprehensive view of user experience and guide decision-making to improve the overall user experience and drive business success. As a decision-maker, understanding and leveraging product analytics is crucial for making informed, data-driven decisions and staying competitive in today's market.
Why is it important?
Product analytics is critical for understanding how people are using your product. With data from product analytics, we can identify which features are most commonly used. It enables us to identify opportunities for improvement of features whether through product and engineering or through marketing efforts. It can also show how often and when users are logging in and how often they return to the product, giving you significant insight in user engagement and retention.
Your competitors are measuring engagement and retention in their games, and it’s giving them an edge in understanding how to drive revenues and improve the player experience.
Before implementing analytics, it is essential to establish clear goals, such as increasing engagement with specific features, driving revenue through NFTs or In-App Purchases, or improving the overall player experience.
Metrics for Games and Web3 NFT Gaming
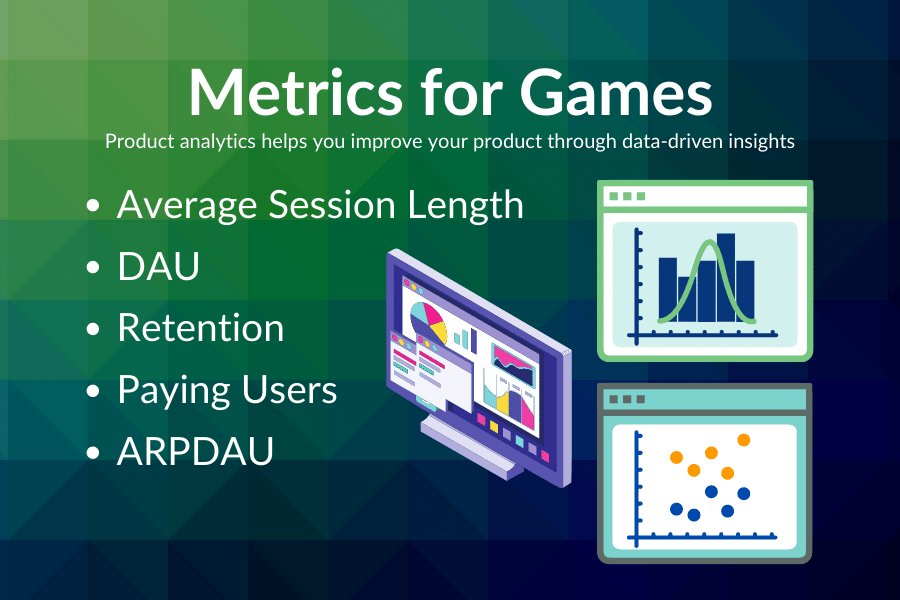
Some of the metrics for games that are important include (GameAnalytics as a great list of metrics and KPIs):
- Average session length
- DAU, daily active users
- Retention, the number of players returning every day or after some number of days
- Load times, how quickly the game loads and how quickly each screen or level loads
- Paying users, number of users who have made purchases in day
- Win percentage, how often players are completing levels or winning rounds in the game
It may also be important to keep track of which devices and operating systems players are playing the game on. For Web3 NFT games, the type of wallet used can be useful to know for QA purposes to ensure that there is more testing with those wallets. Knowing that some players spend a lot on NFTs can also be a useful way to segment the audience for airdrops or game features.
For all games, DAU and MAU are important to measure. The number of daily active users and monthly active users provides an overview of the player base and are indicative of the engagement that a game has. During holidays and marketing launches, the number of daily active users may increase a lot for a short period of time.
Metrics for Websites and E-commerce
Some of the metrics a website or e-commerce site will want to keep track of are:
- Revenue
- Popular products and product categories viewed
- Popular products added to cart
- Average session length
- Traffic sources
E-commerce and websites will want to track every link click and page navigation event to understand which pages, articles, products and product categories are being viewed.
For e-commerce, the checkout process is a funnel that needs to be measured to see where customers are dropping off. It could be because there are too many distractions on the checkout page, or it could be because form validation is not working correctly, or because there is some other problem with the checkout user experience.
What product analytics tools and mobile game analytics services are available?
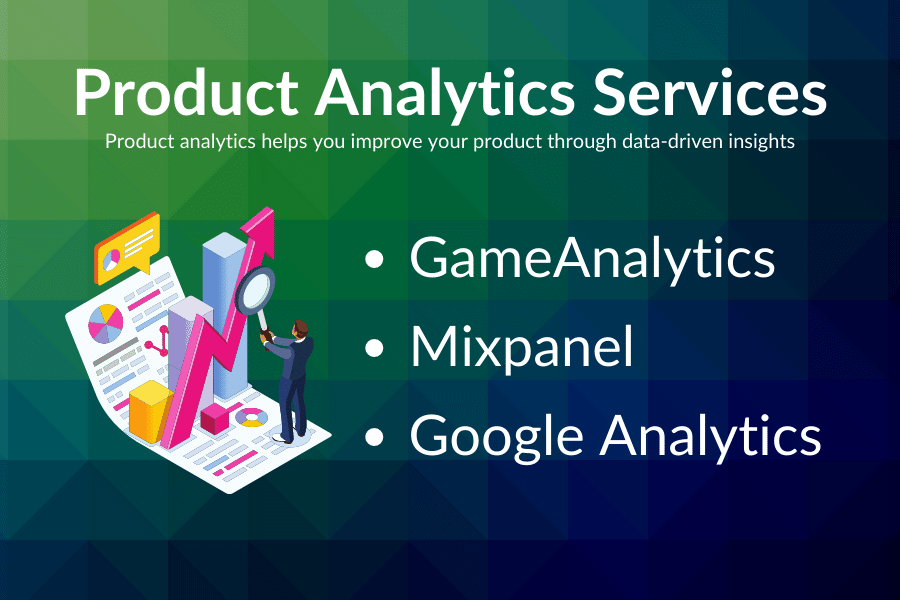
There are several product analytics tools available on the market, both cloud-based SaaS options and self-hosted solutions. You can compare them based on whether they automatically track events, what their reports are like, whether they can send data to other databases and reporting tools, pricing plans. Certain product analytics services are better suited for mobile game analytics than others.
GameAnalytics
GameAnalytics is a service that provides event tracking with a focus on game industry metrics. They include KPIs (Key Performance Indicators) in their dashboards and reporting that are designed for game developers and publishers to better understand players in-game actions. They have an additional product for A/B testing and managing game configurations remotely so that you can customize the game experience for each player.
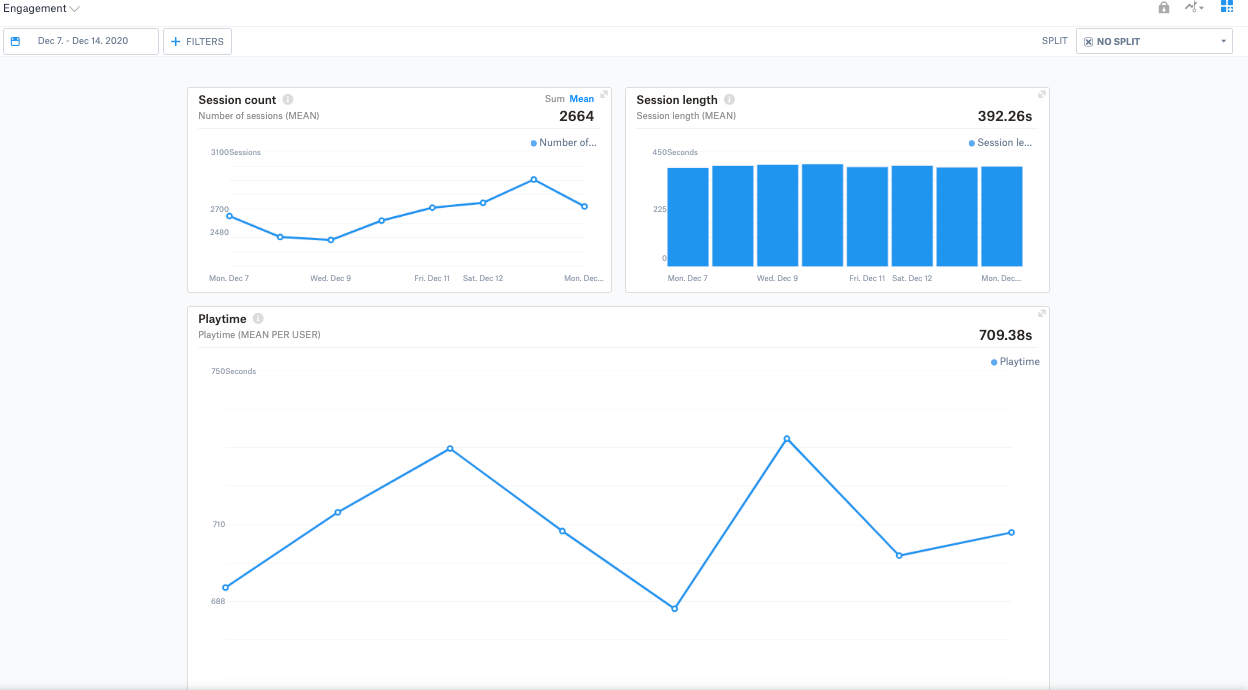
GameAnalytics provides a default dashboard that tracks key metrics such as playtime, daily active users (DAU), in-app purchase (IAP) revenue, and retention. Additionally, they allow you to define custom cohort groups to track events over a specific time period, providing valuable insights for strategic decision-making.
GameAnalytics is a game industry-focused product that offers a comprehensive suite of event tracking tools. Their seven event types (business, resource, progression, error, design, ads, and impression) provide a complete picture of player behavior, from the moment they click on an ad to the moment they level up in the game.
With GameAnalytics, game developers can gain valuable insights into player behavior and optimize their game for the best possible experience.
GameAnalytics SDKs have first-class support for Unity, Unreal Engine, Roblox, Meta Quest 2, GameMaker, Godot, Cocos2D, Construct and Defold. They also have SDKs for C++, C# and JavaScript.
If you are using any other programming language such as Python or Java, you can use their Collection API directly with an HTTP client library.
Mixpanel
Mixpanel is a powerful analytics tool that is specifically designed for mobile apps and web apps. In addition to its focus on mobile and web app analytics, Mixpanel can also be used for tracking user behavior in games.
It offers powerful features such as support for cohort analysis and easy-to-use reporting tools.
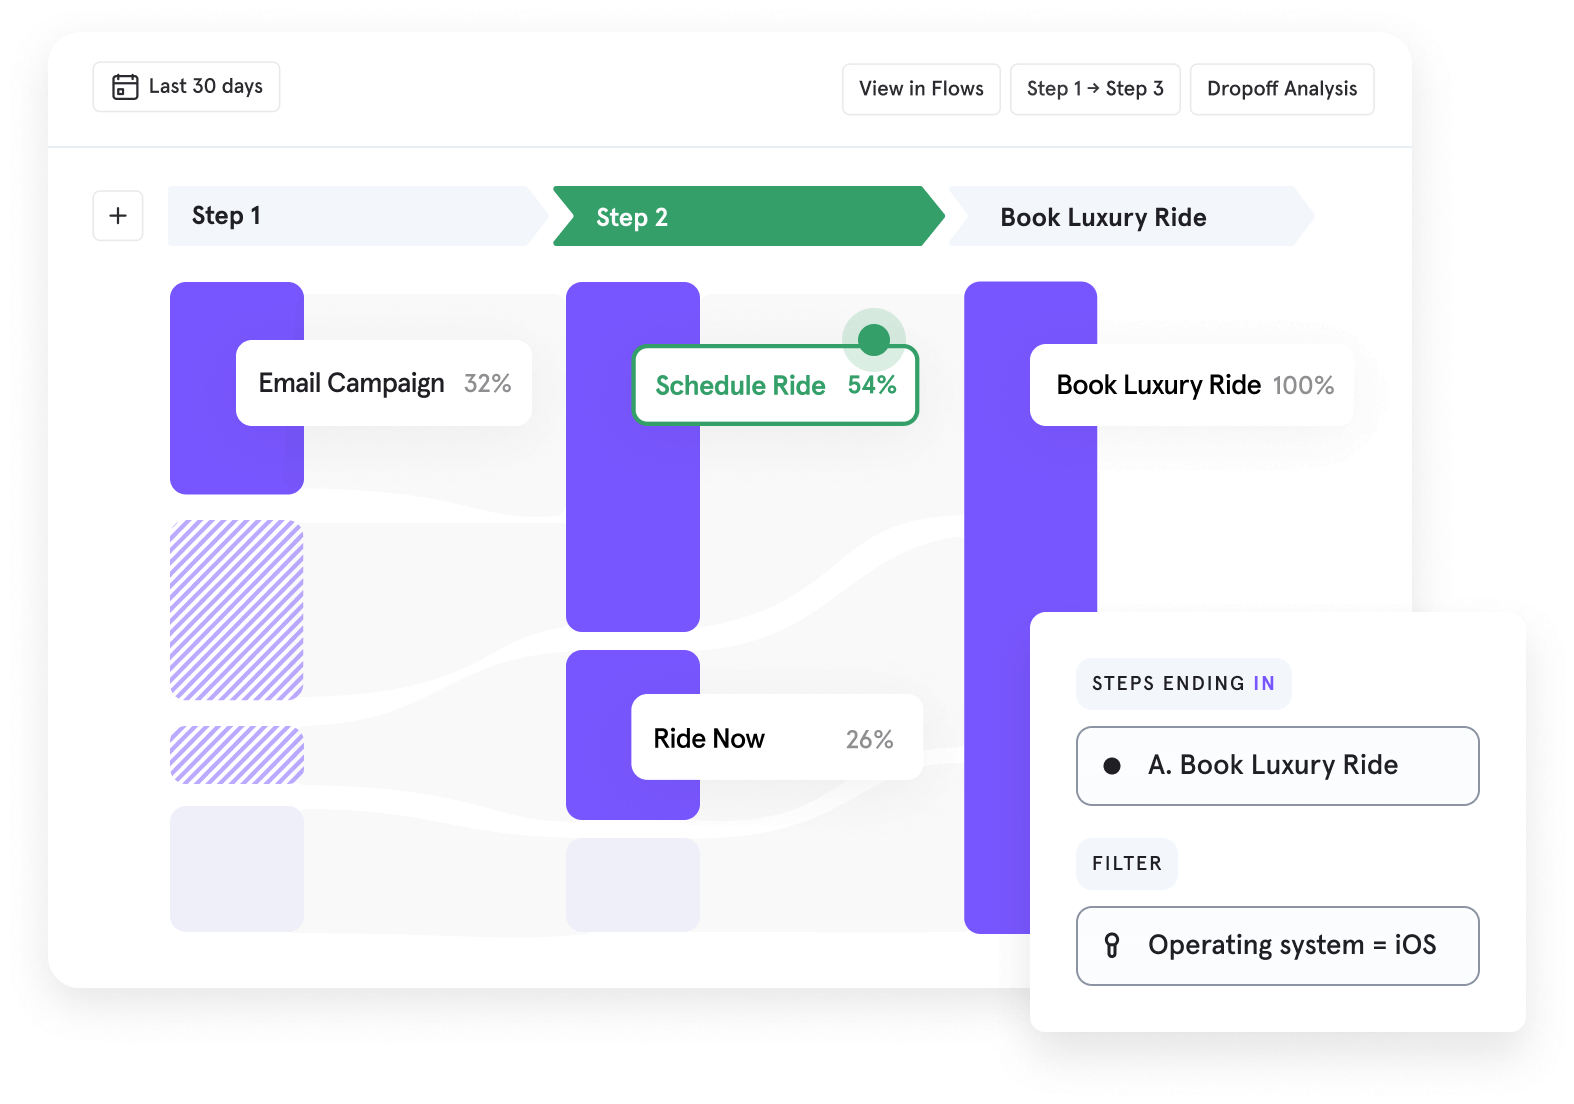
Mixpanel provides four main types of reports: insights, funnels, retention, and flows. The insights report provides detailed information about how long game sessions are, which features and pages in the game are being visited. The funnel report allows you to track how many users are seeing a notification and then taking a specific action, such as clicking a link or using a new feature.
The retention report shows you the D1, D5, D7 and D30 retention, and can answer the question of how many players are coming back after a week which can help you understand user engagement and retention.
Finally, the flow report allows you to see how users are moving through your app, which can help you identify where players are starting from before they engage with a specific event or feature.
Mixpanel has SDKs for JavaScript, Unity, React Native, Flutter, iOS and Android. This makes it easy to integrate Mixpanel into your existing tech stack and start tracking important metrics right away.
One of the standout features of Mixpanel is the excellent documentation provided. This documentation not only guides you through the process of implementing Mixpanel, but also highlights many of the key considerations that you should keep in mind when setting up your analytics.
For example, the documentation discusses the pros and cons of performing analytics on the client-side versus the server-side, offers suggestions on how to name the events that you track, and provides guidance on how to use Mixpanel's "time event" feature to measure durations.
Mixpanel has its own query language, JQL, which can be used to query raw events to generate custom reports.
Google Analytics
Google Analytics is a powerful and widely used tool for tracking events on websites, blogs, and ecommerce sites. With Google Analytics, you can track user interactions on your website or app, such as page views, clicks, and form submissions, and gain valuable insights into the behavior of your users. This information can help you improve the user experience, increase engagement, and drive conversions on your website or app.
However, Google Analytics is not as widely used for tracking events in games and mobile apps. This is because games and mobile apps often have different tracking needs and requirements, and there are other specialized tools that are better suited for this purpose. Despite this, it is still possible to use Google Analytics for tracking events in games and mobile apps, although it may require some additional setup and configuration.
By default, when implementing Google Analytics it keeps track of each page that is viewed and the traffic source. This information is particularly valuable for ecommerce sites where it’s important to understand whether customers are arriving on a landing page and buying a product or are exploring the website through various category pages or if they’re having issues with searching for a product.
In addition to tracking page views and traffic sources, Google Analytics (and other tools) also tracks the country and device type that your website or app is being accessed from. For a website, this information can inform decisions about which web browsers to test on or which web browsers to drop support for or if the mobile layout of the site needs to be improved.
The advantage of Google Analytics for ecommerce is that it can be connected to the Google Search console and to Google Ads. This enables an ecommerce site owner to understand which search keywords are being searched and leading to a product or article page. It helps them understand which paid advertisements are driving traffic to their website.
Overall, Google Analytics is a valuable tool for website and app owners who want to gain insights into user behavior and improve the user experience on their platform. While it may not be the best option for tracking events in games and mobile apps, it can still be used for this purpose with some additional effort.